Channels metrics
Analyse which channels that your bot is published on get the most traffic.
Learn which channels you have published your bot on are preferred by your users.
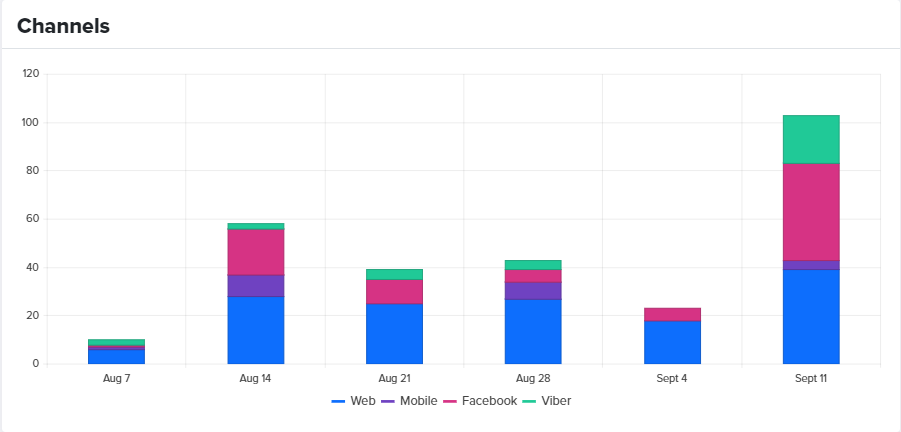
This chart shows the user sessions over a period distributed by channel.
In the example above, in the week that starts on Aug 14, there were 28 sessions on the Web channel, 9 sessions on the Mobile channel, 19 sessions on the Facebook Messenger channel and 2 sessions on the Viber channel.
Somethings missing or not clear?
Ask a question in our community forums or submit a support ticket.