Chatbot Performance Analytics
Building a chatbot is only the first step in making it useful. Use NativeChat’s built-in analytics dashboard to monitor your bot performance, look for areas to optimize, and fix broken conversation flows.
To check your bot’s performance, go to the Analytics tab. Once there you can adjust the period for which you want to see data and the aggregation type - daily, weekly or monthly. The default time period is 6 weeks back and the default aggregation type is weekly. The data is also showing the current (unfinished) week.
Period summary
The period summary gives a general overview on how the bot performed over the selected period.
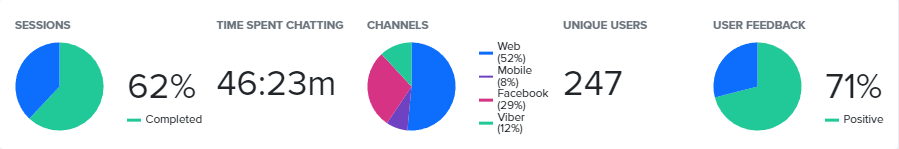
- The Sessions chart shows the percentage of completed sessions for the selected period.
- Time spent chatting shows the overall time users spent chatting with the bot for the selected period.
- The Channels chart shows user sessions distribution by channel for the selected period.
- Unique users shows the number of unique users that have interacted with the bot for the selected period.
- The User Feedback chart shows the percentage of positive user feedback for conversations and QnAs for the selected period.
Somethings missing or not clear?
Ask a question in our community forums or submit a support ticket.