User Retention
Analyse how many unique users interact with your bot and how much time they spend.
Learn how many unique users interact with your bot and how much time they spend chatting with it.
Unique users
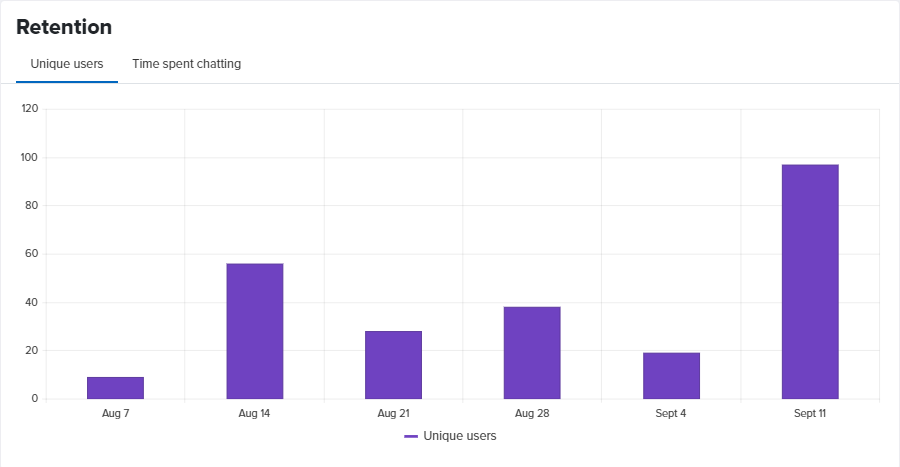
Shows how many unique users interact with the bot over the period.
In the example above 9 users had talked with the bot during the week that starts on Aug 7. In the following week this number rises to 56, and the final week of the period the number of unique users has reached 97.
Time spent chatting
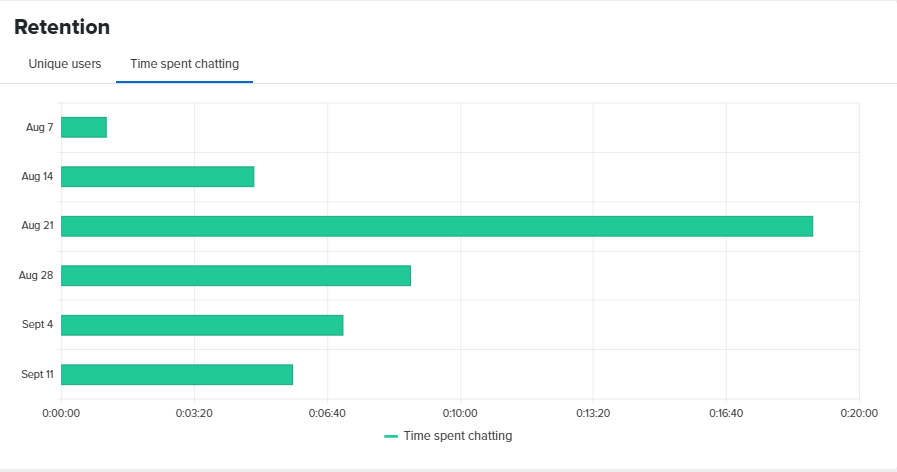
This chart shows how much time users have spent chatting with your bot over the selected period. You can use this metric to estimate the ROI on the bot handling user requests that would otherwise require human customer support.
Somethings missing or not clear?
Ask a question in our community forums or submit a support ticket.