User Engagement Metrics
Analyse how your bot keeps your users engaged.
Learn how many people are using your bot and how successful they are.
Completed sessions
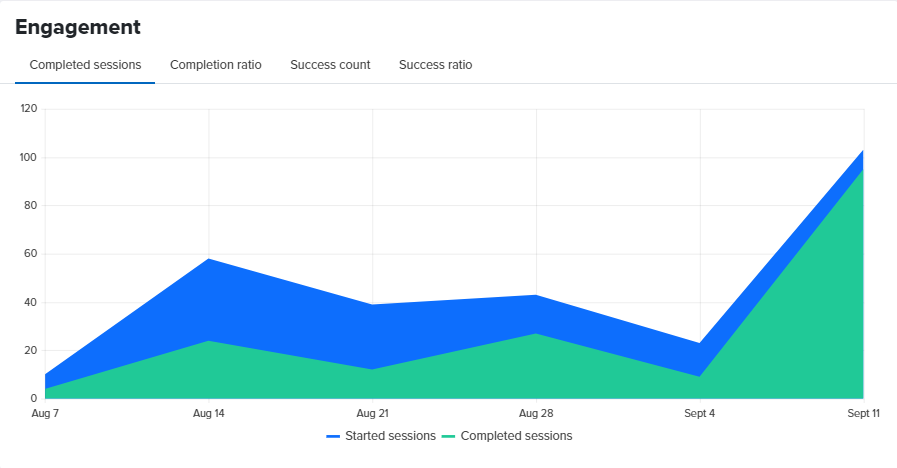
The chart shows the number of sessions started vs. completed. This gives you an idea of how many people use your bot and how many of them are being able to complete their tasks. If the numbers for completed sessions are lower than expected, you should think of a better way to lead people to interact with your bot.
Completion ratio
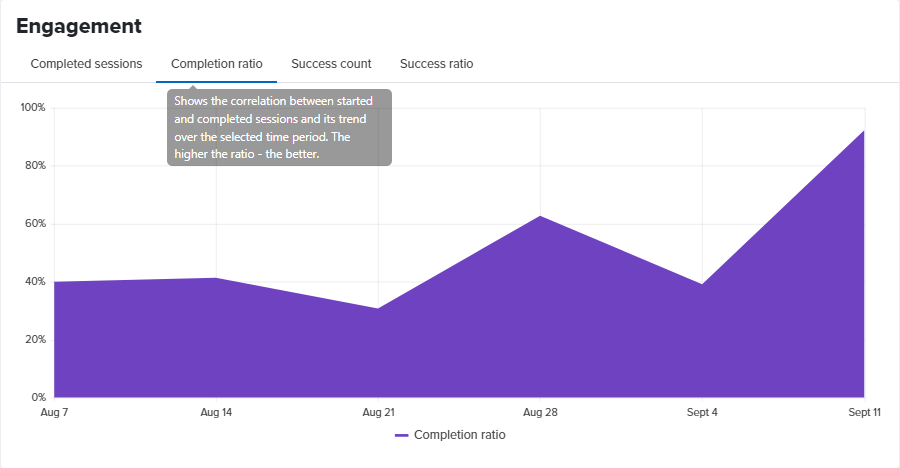
The chart shows the trend of the ratio between the started and completed sessions. Ideally, it should be as high as possible because we would like everybody who starts a conversation with the bot to finish it successfully. When you make changes to the bot, make sure you come back and check this trend to see if they have a positive (or negative) impact.
Success count
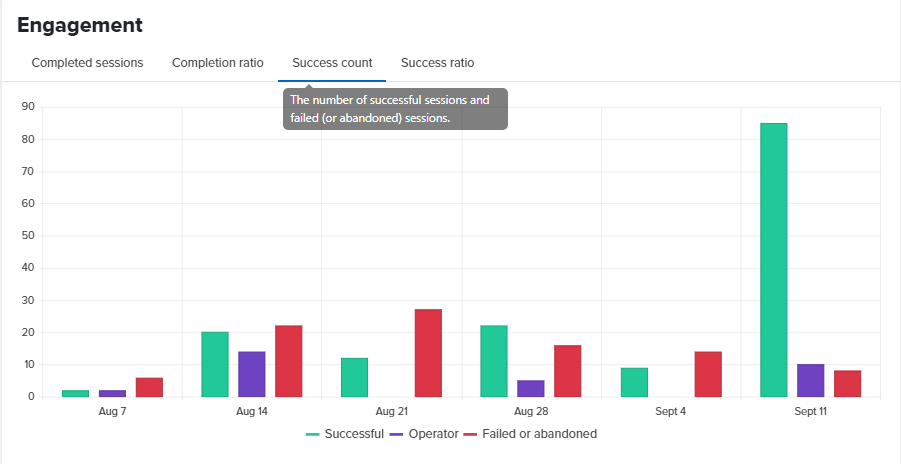
The bars show the number of successful and abandoned sessions and the ones handed off to a human operator.
The purple operator bar on the chart is shown when you have a conversation with a stay-silent command in it. Usually, it is used when you hand off the conversation to a live person to respond to user messages. This chart will show in how many cases the bot was not able to handle the task on its own and the user had to request to contact a human instead.
Success ratio
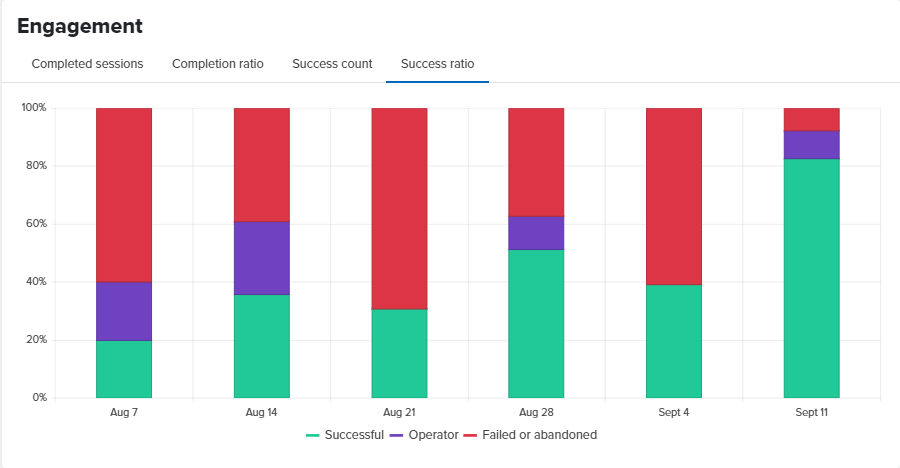
This chart is basically the same as the Success Count one but with percentage proportions.
Somethings missing or not clear?
Ask a question in our community forums or submit a support ticket.